Information Visualization & Infographics: Online Tools
Tools on the Web
There are a number of free and fee-based visualization tools on the web. What you'll find on this page is just a sampling of what's out there!
Explore more tools at datavisualzation.ch and Keshif
Google Tools
-
 Google Public Data Explorer
Visualize world data from a variety of providers including World Bank, U.S. Bureau of Labor Statistics, Destatis, and more. Share or embed dynamic charts, graphs, and maps. You can also upload and publish your own data.
Google Public Data Explorer
Visualize world data from a variety of providers including World Bank, U.S. Bureau of Labor Statistics, Destatis, and more. Share or embed dynamic charts, graphs, and maps. You can also upload and publish your own data. -
Google Ngram ViewerThis tool searches Google Books to produce charts that display the frequency of use of phrases or words beginning in 1500. Embed, share, or Tweet these charts.
-
Google Charts
Use Google's Charts to customize charts for websites and mobile devices.
-
Google Data StudioCreate reports and visualizations. Meant for businesses.
Microsoft
Microsoft's Vizio program helps you create visual representions such as diagrams or flowcharts. Vizio comes with Microsoft Office 365, which is free to all CSUSB students! Find out more about how to get Office and other software here:
-
CSUSB Student SoftwareFrom CSUSB's IT office, free or low-cost software available to current students.
Free Online Tools
-
Social Explorer This link opens in a new window(CSUSB users only.) Generate maps and tables from data on U.S. demographics, economic conditions, and more. Check out our Social Explorer Library Guide for instruction on how to create maps and tables.
-
Euromonitor Passport This link opens in a new window(CSUSB users only.) Check the "Dashboard" for maps with economic data; easily exported for use in documents and powerpoints.
-
 Gapminder
Explore global data and macro-trends through interactive, time-based maps and graphs. Covers major aspects of global development such as: Environment, Health, Energy, Gender, Economy, Demography and Governance. Data is downloadable, and users can also access lesson plans, videos, and more.
Gapminder
Explore global data and macro-trends through interactive, time-based maps and graphs. Covers major aspects of global development such as: Environment, Health, Energy, Gender, Economy, Demography and Governance. Data is downloadable, and users can also access lesson plans, videos, and more.
How to Use Gapminder Bubbles video.
-
 Infogr.am
So easy and so much fun! Upload and edit data to create quick and attractive infographics for presentations. Add images or video and annotate before downloading, sharing, or embedding.
Infogr.am
So easy and so much fun! Upload and edit data to create quick and attractive infographics for presentations. Add images or video and annotate before downloading, sharing, or embedding. -
 Piktochart
Upload your data to create infographics, reports, posters, and presentations.
Piktochart
Upload your data to create infographics, reports, posters, and presentations. -
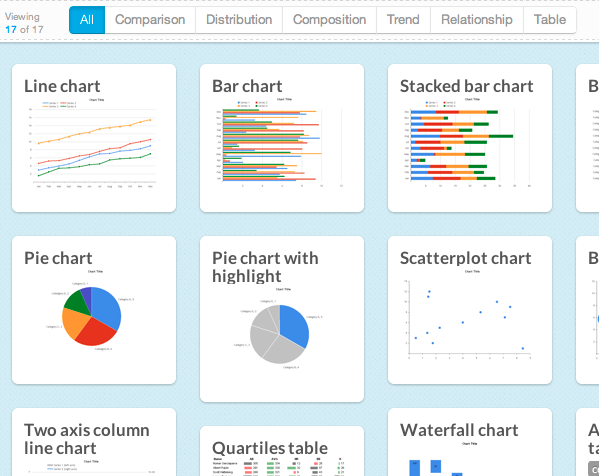 Chart Chooser
Very helpful tool to help you determine the type of chart to meet your communication needs! Download chart templates for Excel or PowerPoint.
Chart Chooser
Very helpful tool to help you determine the type of chart to meet your communication needs! Download chart templates for Excel or PowerPoint. -
 Tableau Public
Download this free tool to create, embed, and share interactive graphs, dashboards, maps, and tables using your own data.
Tableau Public
Download this free tool to create, embed, and share interactive graphs, dashboards, maps, and tables using your own data.
-
CanvaCreate infographics as well as other kinds of graphics.
-
DatawrapperPopular among journalists, Datawrapper allows you to simply copy and paste your data, choose a chart or map for visualization, and publish.
-
VenngageCreate infographics, reports, banners, and much more.
Fun Stuff
-
Easel.lySelect a visual theme template or start from scratch to create your own infographic. This tool is best for those who want to share ideas visually but don't want to rely too heavily on data.
-
WordleUse Wordle to craft word clouds. Great for teaching and presentations!
-
 Kantar Information is Beautiful Awards
The Kantar Information is Beautiful Awards celebrate excellence and beauty in data visualizations, infographics, interactives & information art.
Kantar Information is Beautiful Awards
The Kantar Information is Beautiful Awards celebrate excellence and beauty in data visualizations, infographics, interactives & information art. -
 Information is Beautiful
This site provides countless visualizations on a variety of topics including climate, health, food, music, people, and more.
Information is Beautiful
This site provides countless visualizations on a variety of topics including climate, health, food, music, people, and more. -
 Flowing Data: Data Visualization, Infographics, and Statistics
Keep up-to-date in the field here. This site includes courses, tutorials, guides, and of course, many visualizations! Subscription required for full access.
Flowing Data: Data Visualization, Infographics, and Statistics
Keep up-to-date in the field here. This site includes courses, tutorials, guides, and of course, many visualizations! Subscription required for full access.